Bodenschutz/en: Unterschied zwischen den Versionen
Tschug (Diskussion | Beiträge) |
Tschug (Diskussion | Beiträge) |
||
| (68 dazwischenliegende Versionen von 2 Benutzern werden nicht angezeigt) | |||
| Zeile 1: | Zeile 1: | ||
__NOTOC__ |
__NOTOC__ |
||
| − | == Bodenschutz == |
||
| + | == Soil conservation == |
||
| ⚫ | |||
| − | <p>Der Boden erfüllt vielfältige Funktionen für Umwelt und Gesellschaft. Gleichzeitig stellt er ein empfindliches und nicht vermehrbares Schutzgut dar, das vielen Nutzungsansprüchen ausgesetzt ist. Als Grundlage für den vorsorgenden Bodenschutz werden im Rahmen der Bodenkundlichen Landesaufnahme regionalisierte Daten über die Verbreitung, Leistungsfähigkeit, Schutzwürdigkeit und Gefährdung der Böden im Saarland erstellt. Der Internet Kartendienst des Landesamtes für Umwelt- und Arbeitsschutz hält derzeit acht saarlandweite Fachanwendungen vor.</p> |
||
| ⚫ | |||
| − | == Bodenübersichtskarte == |
||
| + | <p>Soil performs a wide range of functions for the environment and human society. At the same time, soil is a fragile and non-reproducible resource that is exposed to many stresses from usage. As a basis for preventive soil conservation, land surveys conducted by soil scientists collect regionalised data about soil distribution, its state of health and need for protection, and hazards threatening soil in Saarland. The online map service from the State Office of the Environment and Occupational Safety currently offers eight applications for soils across Saarland.</p> |
||
| + | == Soil survey map == |
||
| − | ''(zeigt die Verbreitung der Böden)'' |
||
| + | ''(shows soil distribution)'' |
||
| − | <p>[[File:Bodenuebersichtskarte.jpg|400px|alt=Bodenuebersichtskarte|Bodenübersichtskarte|link=//{{SERVERNAME}}/mapbender/frames/index.php?lang=de&gui_id=Geoportal-SL-2020&WMC=3023]]</p> |
||
| ⚫ | |||
| − | <p>Die Bodenübersichtskarte im Maßstab 1:100.000 (BÜK 100) zeigt eine regionalisierte Darstellung des bodenkundlichen Inventars. Maßstabsbedingt und aufgrund des engräumig wechselnden Untergrundes im Saarland sind die auftretenden Bodeneinheiten meist als Bodengesellschaften charakterisiert. Ein ausführlicher Erläuterungstext bietet Informationen zu den ökologischen Eigenschaften der Böden.</p> |
||
| + | <p>The soil survey map uses a 1:100,000 scale (BÜK 100) to offer a regionalised presentation of the soil science inventory. For reasons of scale and also because of the closely-spaced substrate transitions in Saarland, the extant soil units are typically characterised as ‘soil clusters’. A detailed guide provides explanations of the ecological properties of these soils.</p> |
||
| ⚫ | |||
| + | |||
| + | <p><strong>[//{{SERVERNAME}}/mapbender/frames/index.php?lang=de&gui_id=Geoportal-SL-2020&WMC=3023 Go to application: ‘Soil survey map (BÜK 100)’]</strong></p> |
||
---- |
---- |
||
| − | == |
+ | == Quaternary map == |
| + | ''(offers insights into the most recent geological period in Saarland)'' |
||
| − | ''(gibt einen Einblick in den jüngsten erdgeschichtlichen Zeitraum des Saarlandes)'' |
||
| − | <p>[[File:quartaerkarte.jpg|400px|alt= |
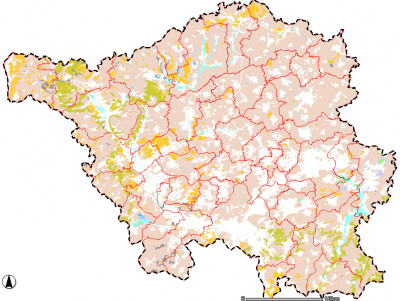
+ | <p>[[File:quartaerkarte.jpg|400px|alt=Quaternary map|Quaternary map|link=//{{SERVERNAME}}/mapbender/frames/index.php?lang=de&gui_id=Geoportal-SL-2020&WMC=3024]]</p> |
| + | <p>The quaternary period has left its mark in Saarland both in the form of independent substrates such as loess sections or river terrace deposits as well as periglacial processes of formation that have affected the uppermost layers of the pre-quaternary bedrock.</p> |
||
| − | <p>Das Quartär dokumentiert sich im Saarland sowohl in eigenständigen Substraten wie Lößlehmen oder Flußterrassenablagerungen als auch in periglazialen Formungsprozessen, die die obersten Bereiche des präquartären Gesteinsuntergrundes erfasst haben.</p> |
||
| − | <p><strong>[//{{SERVERNAME}}/mapbender/frames/index.php?lang=de&gui_id=Geoportal-SL-2020&WMC=3024 |
+ | <p><strong>[//{{SERVERNAME}}/mapbender/frames/index.php?lang=de&gui_id=Geoportal-SL-2020&WMC=3024 Go to application: ‘Quaternary map’]</strong></p> |
---- |
---- |
||
| − | == |
+ | == Map of nitrate retention capacity == |
| + | ''(charts the storage capacity in the vadose zone for nitric nitrogen)'' |
||
| − | ''(dokumentiert das Speichervermögen der Bodenzone für Nitratstickstoff)'' |
||
| − | <p>[[File:nitrat.jpg|400px|alt= |
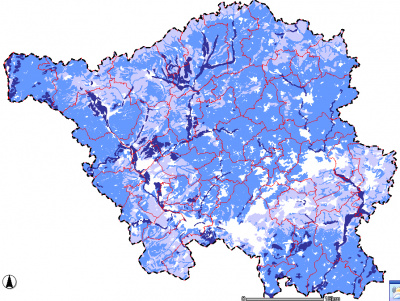
+ | <p>[[File:nitrat.jpg|400px|alt=Map of nitrate retention capacity|Map of nitrate retention capacity|link=//{{SERVERNAME}}/mapbender/frames/index.php?lang=de&gui_id=Geoportal-SL-2020&WMC=3026]]</p> |
| + | <p>The nitrate retention capacity of soils in Saarland has been determined on the basis of the soil survey map and physical soil data from the Saarland Soil Information System (SAARBIS). The 1:100,000 scale survey map is used to identify soils that have a higher level of risk exposure for nitrate discharges into groundwater.</p> |
||
| − | <p>Das Nitratrückhaltevermögen der Böden im Saarland wurde auf Grundlage der BÜK 100 und bodenphysikalischer Daten aus dem Bodeninformationssystem des Saarlandes (SAARBIS) ermittelt. Die Übersichtskarte im Maßstab 1:100.000 dient zur Identifizierung von Böden, die ein erhöhtes Risikopotenzial für Nitratausträge ins Grundwasser aufweisen.</p> |
||
| − | <p><strong>[//{{SERVERNAME}}/mapbender/frames/index.php?lang=de&gui_id=Geoportal-SL-2020&WMC=3026 |
+ | <p><strong>[//{{SERVERNAME}}/mapbender/frames/index.php?lang=de&gui_id=Geoportal-SL-2020&WMC=3026 Go to application: ‘Nitrate retention capacity’]</strong></p> |
---- |
---- |
||
| − | == |
+ | == Map of natural yield potential == |
| + | ''(offers information about soil fertility)'' |
||
| − | ''(gibt Auskunft über die Fruchtbarkeit der Böden)'' |
||
| − | <p>[[File:ertrag.jpg|400px|alt= |
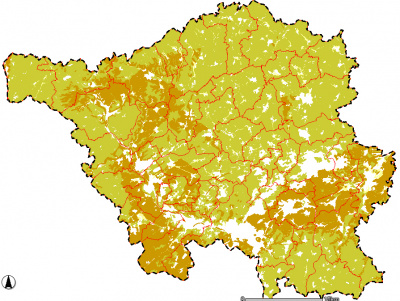
+ | <p>[[File:ertrag.jpg|400px|alt=Map of natural yield potential|Map of natural yield potential|link=//{{SERVERNAME}}/mapbender/frames/index.php?lang=de&gui_id=Geoportal-SL-2020&WMC=3027]]</p> |
| + | <p>The presentation of the natural yield potential for agrarian soils addresses one of the usage functions defined in the German Federal Soil Protection Law (BBodSchG), section 2(2) and characterises the capacity of the soil to produce food as well as energy crops.</p> |
||
| − | <p>Die Darstellung des natürlichen Ertragspotenzials landwirtschaftlich genutzter Böden thematisiert eine der im BBodSchG nach § 2(2) definierten Nutzungsfunktionen und charakterisiert die Leistungsfähigkeit des Bodens zur Produktion von Nahrungsmitteln und Energiepflanzen.</p> |
||
| − | <p><strong>[//{{SERVERNAME}}/mapbender/frames/index.php?lang=de&gui_id=Geoportal-SL-2020&WMC=3027 |
+ | <p><strong>[//{{SERVERNAME}}/mapbender/frames/index.php?lang=de&gui_id=Geoportal-SL-2020&WMC=3027 Go to application: ‘Natural yield potential’]</strong></p> |
---- |
---- |
||
| − | == |
+ | == Map of soil field capacity == |
| + | ''(characterises soil water retention capacity)'' |
||
| − | ''(charakterisiert das Wasserspeichervermögen der Böden)'' |
||
| − | <p>[[File:feldkapazitaet.jpg|400px|alt= |
+ | <p>[[File:feldkapazitaet.jpg|400px|alt=Map of soil field capacity|Map of soil field capacity|link=//{{SERVERNAME}}/mapbender/frames/index.php?lang=de&gui_id=Geoportal-SL-2020&WMC=3028]]</p> |
| + | <p>The 1:100,000 scale survey map presents a core parameter as utilised in soil water management. The term ‘field capacity’ refers to the quantity of water that a soil in a natural state can retain after gravitational drainage and is a metric for soil water retention capacity. To ensure results are comparable, field capacity is evaluated up to a profile depth of 10 dm (FK10).</p> |
||
| − | <p>Die Übersichtskarte im Maßstab 1:100.000 bildet eine zentrale Kenngröße zum Bodenwasserhaushalt ab. Die Feldkapazität ist die Wassermenge, die ein Boden in natürlicher Lagerung maximal gegen die Schwerkraft zurückhalten kann und ein Maß für die Wasserspeicherkapazität des Bodens. Zur Vergleichbarkeit der Ergebnisse erfolgt die Bewertung der Feldkapazität bis 10 dm Profiltiefe (FK10).</p> |
||
| − | <p><strong>[//{{SERVERNAME}}/mapbender/frames/index.php?lang=de&gui_id=Geoportal-SL-2020&WMC=3028 |
+ | <p><strong>[//{{SERVERNAME}}/mapbender/frames/index.php?lang=de&gui_id=Geoportal-SL-2020&WMC=3028 Go to application: ‘Soil field capacity’]</strong></p> |
---- |
---- |
||
| − | == |
+ | == Map of soil air capacity == |
| + | ''(provides information about supply of oxygen to plant roots)'' |
||
| − | ''(informiert über die Versorgung der Pflanzenwurzeln mit Sauerstoff)'' |
||
| − | <p>[[File:Luft.jpg|400px|alt= |
+ | <p>[[File:Luft.jpg|400px|alt=Map of soil air capacity|Map of soil air capacity|link=//{{SERVERNAME}}/mapbender/frames/index.php?lang=de&gui_id=Geoportal-SL-2020&WMC=3029]]</p> |
| + | <p>Air capacity is determined by measuring the proportion of macropores (coarse pores) in the soil pore space. Air capacity is a metric for the supply of oxygen to plant roots as well as soil aeration. To ensure results are comparable, air capacity is evaluated up to a profile depth of 10 dm (LK10).</p> |
||
| − | <p>Die Luftkapazität wird durch den Anteil der weiten Grobporen im Porenraum des Bodens bestimmt. Sie kennzeichnet die Versorgung der Pflanzenwurzeln mit Sauerstoff und die Durchlüftung der Böden. Zur Vergleichbarkeit der Ergebnisse erfolgt die Bewertung der Luftkapazität bis 10 dm Profiltiefe (LK10).</p> |
||
| − | <p><strong>[//{{SERVERNAME}}/mapbender/frames/index.php?lang=de&gui_id=Geoportal-SL-2020&WMC=3029 |
+ | <p><strong>[//{{SERVERNAME}}/mapbender/frames/index.php?lang=de&gui_id=Geoportal-SL-2020&WMC=3029 Go to application: ‘Soil air capacity’]</strong></p> |
---- |
---- |
||
| + | == Map of location typing and soil potential for biotope development == |
||
| − | == Karte der Standorttypisierung und des Biotopentwicklungspotenzials der Böden == |
||
| + | ''(presents the soil’s characteristic biotope functions for vegetation)'' |
||
| − | ''(Darstellung der vom Boden geprägten Lebensraumfunktionen für die Vegetation)'' |
||
| − | <p>[[File:biotopentwicklung.jpg|400px|alt= |
+ | <p>[[File:biotopentwicklung.jpg|400px|alt=Map of location typing and soil potential for biotope development|Map of location typing and soil potential for biotope development|link=//{{SERVERNAME}}/mapbender/frames/index.php?lang=de&gui_id=Geoportal-SL-2020&WMC=3030]]</p> |
| + | <p>Location typing for soils in Saarland is based on the soil units from the Saarland soil survey map (1:100,000 scale), which have been grouped into 11 location types featuring different moisture regimes and material inventories. Depending on water content and the supply of nutrients, the various location types offer high to very high potential for biotope development.</p> |
||
| − | <p>Für die Standorttypisierung der Böden des Saarlandes wurden die Bodeneinheiten der Bodenübersichtskarte des Saarlandes im Maßstab 1:100.000 zu 11 Standorttypen mit unterschiedlichem Feuchteregime und Stoffbeständen gruppiert. In Abhängigkeit von Wassergehalt und Nährstoffversorgung weisen die Standorttypen ein hohes bis sehr hohes Biotopentwicklungspotenzial auf.</p> |
||
| − | <p><strong>[//{{SERVERNAME}}/mapbender/frames/index.php?lang=de&gui_id=Geoportal-SL-2020&WMC=3030 |
+ | <p><strong>[//{{SERVERNAME}}/mapbender/frames/index.php?lang=de&gui_id=Geoportal-SL-2020&WMC=3030 Go to application: ‘Map of location typing and soil potential for biotope development’]</strong></p> |
---- |
---- |
||
| + | == Map of buffer areas for topsoils under forest management == |
||
| − | == Karte der Pufferbereiche von Oberböden unter forstwirtschaftlicher Nutzung == |
||
| + | ''(shows a regionalised picture of soil acidification)'' |
||
| − | ''(zeigt ein regionalisiertes Bild der Bodenversauerung)'' |
||
| − | <p>[[File:pufferbereiche.jpg|400px|alt= |
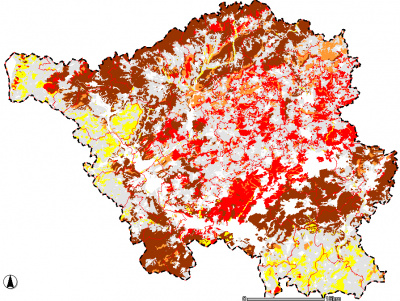
+ | <p>[[File:pufferbereiche.jpg|400px|alt=Map of buffer areas for topsoils under forest management|Map of buffer areas for topsoils under forest management|link=//{{SERVERNAME}}/mapbender/frames/index.php?lang=de&gui_id=Geoportal-SL-2020&WMC=3031]]</p> |
| + | <p>The 1:100,000 scale map shows the buffer areas for soils and therefore provides an indicator for the extent of soil acidification. The dataset represents analyses carried out until 1995: accordingly, acidic inputs spanning almost two decades are not accounted for. Recent data are available from studies conducted on specific territories and will be provided at a later date.</p> |
||
| − | <p>Die Karte im Maßstab 1:100.000 bildet die Pufferbereiche von Böden und damit einen Indikator für das Ausmaß der Bodenversauerung ab. Die Datenbasis repräsentiert Untersuchungen bis zum Jahr 1995, so dass die Säureeinträge von fast zwei Dekaden unberücksichtigt bleiben. Aktuelle Daten liegen für gebietsbezogenen Studien vor und sind zu einem späteren Zeitpunkt verfügbar.</p> |
||
| − | <p><strong>[//{{SERVERNAME}}/mapbender/frames/index.php?lang=de&gui_id=Geoportal-SL-2020&WMC=3031 |
+ | <p><strong>[//{{SERVERNAME}}/mapbender/frames/index.php?lang=de&gui_id=Geoportal-SL-2020&WMC=3031 Go to application: ‘Map of buffer areas for topsoils under forest management’]</strong></p> |
| − | == |
+ | == Contacts == |
| − | ''' |
+ | '''State Office for the Environment and Occupational Safety'''<br /> |
| + | Dept. 2.2 Soil Protection and Geology<br /> |
||
| − | Landesamt für Umwelt- und Arbeitsschutz "Schutzgebiete und Boden"<br /> |
||
Katja Drescher-Larres<br /> |
Katja Drescher-Larres<br /> |
||
| − | [mailto:k.drescher-larres@lua.saarland.de |
+ | [mailto:k.drescher-larres@lua.saarland.de Email]<br /> |
| − | + | Phone: +49 681 8500-1160<br /> |
|
Aktuelle Version vom 31. August 2022, 08:25 Uhr
Soil conservation
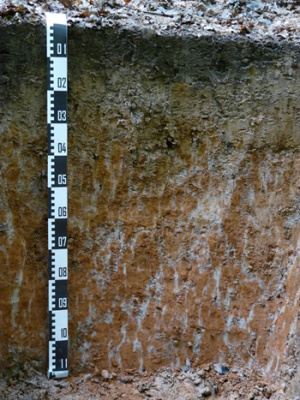
Soil performs a wide range of functions for the environment and human society. At the same time, soil is a fragile and non-reproducible resource that is exposed to many stresses from usage. As a basis for preventive soil conservation, land surveys conducted by soil scientists collect regionalised data about soil distribution, its state of health and need for protection, and hazards threatening soil in Saarland. The online map service from the State Office of the Environment and Occupational Safety currently offers eight applications for soils across Saarland.
Soil survey map
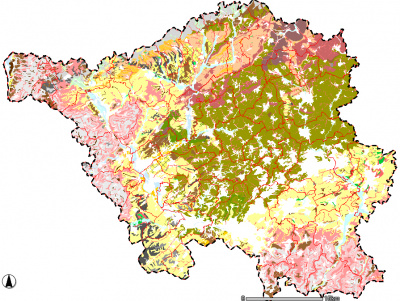
(shows soil distribution)
The soil survey map uses a 1:100,000 scale (BÜK 100) to offer a regionalised presentation of the soil science inventory. For reasons of scale and also because of the closely-spaced substrate transitions in Saarland, the extant soil units are typically characterised as ‘soil clusters’. A detailed guide provides explanations of the ecological properties of these soils.
Go to application: ‘Soil survey map (BÜK 100)’
Quaternary map
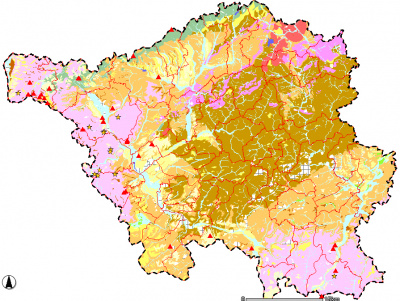
(offers insights into the most recent geological period in Saarland)
The quaternary period has left its mark in Saarland both in the form of independent substrates such as loess sections or river terrace deposits as well as periglacial processes of formation that have affected the uppermost layers of the pre-quaternary bedrock.
Go to application: ‘Quaternary map’
Map of nitrate retention capacity
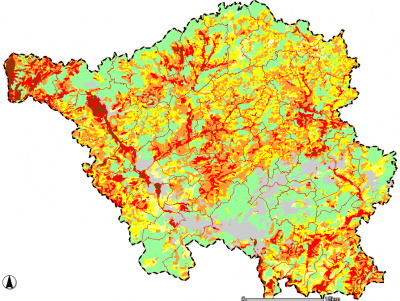
(charts the storage capacity in the vadose zone for nitric nitrogen)
The nitrate retention capacity of soils in Saarland has been determined on the basis of the soil survey map and physical soil data from the Saarland Soil Information System (SAARBIS). The 1:100,000 scale survey map is used to identify soils that have a higher level of risk exposure for nitrate discharges into groundwater.
Go to application: ‘Nitrate retention capacity’
Map of natural yield potential
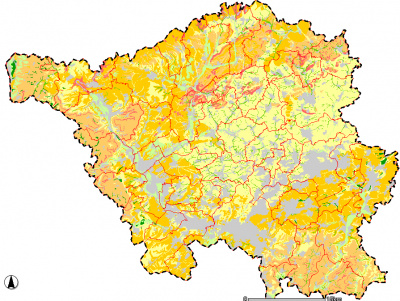
(offers information about soil fertility)
The presentation of the natural yield potential for agrarian soils addresses one of the usage functions defined in the German Federal Soil Protection Law (BBodSchG), section 2(2) and characterises the capacity of the soil to produce food as well as energy crops.
Go to application: ‘Natural yield potential’
Map of soil field capacity
(characterises soil water retention capacity)
The 1:100,000 scale survey map presents a core parameter as utilised in soil water management. The term ‘field capacity’ refers to the quantity of water that a soil in a natural state can retain after gravitational drainage and is a metric for soil water retention capacity. To ensure results are comparable, field capacity is evaluated up to a profile depth of 10 dm (FK10).
Go to application: ‘Soil field capacity’
Map of soil air capacity
(provides information about supply of oxygen to plant roots)
Air capacity is determined by measuring the proportion of macropores (coarse pores) in the soil pore space. Air capacity is a metric for the supply of oxygen to plant roots as well as soil aeration. To ensure results are comparable, air capacity is evaluated up to a profile depth of 10 dm (LK10).
Go to application: ‘Soil air capacity’
Map of location typing and soil potential for biotope development
(presents the soil’s characteristic biotope functions for vegetation)
Location typing for soils in Saarland is based on the soil units from the Saarland soil survey map (1:100,000 scale), which have been grouped into 11 location types featuring different moisture regimes and material inventories. Depending on water content and the supply of nutrients, the various location types offer high to very high potential for biotope development.
Go to application: ‘Map of location typing and soil potential for biotope development’
Map of buffer areas for topsoils under forest management
(shows a regionalised picture of soil acidification)
The 1:100,000 scale map shows the buffer areas for soils and therefore provides an indicator for the extent of soil acidification. The dataset represents analyses carried out until 1995: accordingly, acidic inputs spanning almost two decades are not accounted for. Recent data are available from studies conducted on specific territories and will be provided at a later date.
Go to application: ‘Map of buffer areas for topsoils under forest management’
Contacts
State Office for the Environment and Occupational Safety
Dept. 2.2 Soil Protection and Geology
Katja Drescher-Larres
Email
Phone: +49 681 8500-1160
