Sentinel-2/en: Unterschied zwischen den Versionen
(Die Seite wurde neu angelegt: „frameless|link=“) |
Tschug (Diskussion | Beiträge) K |
||
| (76 dazwischenliegende Versionen von 4 Benutzern werden nicht angezeigt) | |||
| Zeile 1: | Zeile 1: | ||
| + | __NOTOC__ |
||
| − | <languages/> |
||
== Sentinel-2 Saarland == |
== Sentinel-2 Saarland == |
||
| + | [[Datei:sentinel_2.jpg|alt=Sentinel|600px|link=]] |
||
| − | |||
| − | |||
| − | [[Datei:copernicus_logo.jpg|frameless|link=]] |
||
| − | |||
== Viewer == |
== Viewer == |
||
| − | [//{{SERVERNAME}}/mapbender/frames/index.php?gui_id= |
+ | [//{{SERVERNAME}}/mapbender/frames/index.php?gui_id=Sentinel&WMC=4771 Go to map collection for Sentinel-2 data] |
| + | == Description == |
||
| ⚫ | |||
| − | == Beschreibung == |
||
| + | Copernicus is a European Earth observation programme that is organised and conducted by the European Union (EU) in collaboration with the European Space Agency (ESA), the European Organisation for Meteorological Satellites (EUMETSAT) and the EU member states. Copernicus consists of various systems for data collection and combines remote sensing with local measurements (in-situ component). The observational data is used to derive information of relevance for the environment and security for five core services. These services primarily address the environment, climate, sustainable development, humanitarian aid and public security. |
||
| − | |||
| + | The Copernicus programme also maintains its own fleet of satellites: these Sentinel satellites are used for the global observation of the atmosphere, oceans and land surfaces. Sentinel data and the Copernicus services are available free of charge and in full for anyone to use – from public-sector personnel to researchers, commercial companies as well as charitable organisations and private citizens. |
||
| ⚫ | |||
| ⚫ | |||
| + | Saarland’s State Office for Surveying, Geoinformation and Land Development (LVGL) provides continuously updated data from Sentinel-2 satellites free of charge. The Sentinel-2 Mission consists of a pair of structurally identical satellites, which circle the Earth at 180° to one another on the same orbit and at a height of approximately 786 km. This arrangement ensures that Saarland is overflown '''roughly once every five days'''. Sentinel-2 is equipped with a multispectral instrument (MSI) featuring a total of 13 spectral channels (figure 1). |
||
| − | |||
| + | <div><ul> |
||
| − | Copernicus ist ein europäisches Erdbeobachtungsprogramm, das von der Europäischen Union (EU) in Zusammenarbeit mit der Europäischen Weltraumorganisation (ESA), der Europäischen Organisation für meteorologische Satelliten (EUMETSAT) und deren Mitgliedsstaaten durchgeführt wird. Es besteht aus verschiedenen Systemen zur Datengewinnung und verbindet Fernerkundung mit Messungen vor Ort (in-situ Komponente). Aus den Beobachtungsdaten werden umwelt- und sicherheitsrelevante Informationen für 5 Kerndienste abgeleitet. Diese decken vorrangig die Bereiche Umwelt, Klimaschutz, nachhaltige Entwicklung, humanitäre Hilfe sowie sicherheitsrelevante Themen ab. |
||
| ⚫ | |||
| ⚫ | |||
| + | </ul></div> |
||
| + | Cloud cover means that a clear view of the Earth’s surface is often unavailable. Accordingly, the State Office views the current data and provides images of Saarland that are clear of clouds. |
||
| − | Das Copernicus-Programm umfasst zudem eine eigene Satellitenflotte. Die Sentinel-Satelliten dienen der globalen Beobachtung der Atmosphäre, der Ozeane und der Landoberflächen. Die Sentinel-Daten und Copernicus-Dienste sind dabei für jedermann kostenlos und frei verfügbar zu beziehen – egal ob für behördliche Anwender, die Wissenschaft, kommerzielle Unternehmen oder gemeinnützige Organisationen und Bürger. |
||
| + | The image data provided features a '''spatial resolution of 10 m x 10 m''' and is post-processed to the ‘Level-2A’ data standard, i.e. georeferenced, radiometrically optimised and atmosphere-corrected. We recommend viewing the data at a 1:50,000 or smaller scale. Data can be provided via GeoPortal Saarland as well as the ZORA cartographic information system. Data can also be obtained using a web map service (WMS). |
||
| + | The image data is particularly suited to use in large-scale topography applications, where changes in topography, vegetation or land use can be visualised immediately. This availability of up-to-date topographic datasets is a novel development. |
||
| ⚫ | |||
| + | The following products are currently offered by the LVGL: |
||
| − | |||
| ⚫ | |||
| − | Das Landesamt für Vermessung, Geoinformation und Landentwicklung (LVGL) stellt kostenfrei fortlaufend aktuelle Daten der Sentinel-2 Satelliten zur Verfügung. Die Sentinel-2 Mission besteht aus einer Konstellation von zwei baugleichen Satelliten, die die Erde um 180° versetzt auf der gleichen Umlaufbahn in einer Höhe von ca. 786 km umkreist. Durch diese Anordnung wird das Saarland '''mindestens alle fünf Tage''' überflogen. Sentinel-2 verfügt über ein Multispektrales Aufnahmegerät (MSI) mit insgesamt 13 Spektralkanäle (Abbildung 1). |
||
| + | As the name suggests, a true-colour image faithfully represents the original colours and is therefore equivalent to a photograph. The image data represents a combination of the spectral channels B4 (red), B3 (green) and B2 (blue). |
||
| ⚫ | |||
| + | <div><ul> |
||
| ⚫ | |||
| ⚫ | |||
| + | <li style="display: inline-block;">[[Datei:Sentinel-2_Abb3.png|thumb|Figure 3: Sentinel-2 true-colour image taken 04/12/2019, ‘Saar Bow’ detail|link=]]</li> |
||
| + | </ul></div> |
||
| ⚫ | |||
| − | Aufgrund von Wolkenbedeckung ist oftmals keine freie Sicht auf die Erdoberfläche gegeben. Daher sichtet das Landesamt die aktuellen Daten und stellt Wolkenfreie Bilder des Saarlandes zur Verfügung. |
||
| + | A CIR false-colour image (Colored InfraRed) can be used to visualise the health of biomass, such as grasses, leaves on bushes, etc. The channel used for these images is the near-infrared (NIR) channel. Green (healthy) vegetation has a particular ‘spectral fingerprint’: the pigments in this vegetation, such as chlorophyll, are reflected in the green visible spectrum by incident light and this effect is further reinforced in the infrared spectrum. As a result of the high reflectance in the infrared spectrum, healthy plants are therefore especially prominent in infrared. |
||
| − | Die bereitgestellten Bilddaten weisen eine '''räumliche Auflösung von 10 m x 10 m''' auf und werden zu sogenannte Level-2A Daten, d.h. georeferenziert, radiometrisch optimiert und atmosphärenkorrigiert aufbereitet. Wir empfehlen in der Darstellung den Maßstab 1:50.000 und kleiner. Die Daten können über das GeoPortal des Saarlandes sowie über das kartographische Informationssystem ZORA zur Verfügung gestellt. Außerdem können die Daten auch über einen webbasierten Kartendienst, ein sogenannten Web Map-Service (WMS) bezogen werden. |
||
| + | Accordingly, this data can be used to interpret a range of potential manifestations of vegetation, such as mapping forest damage or surveying different types of biotopes. |
||
| − | Die Bilddaten eignen sich speziell für die Zwecke der großflächigen Topographie. Veränderungen in der Topographie, Vegetation oder auch Landnutzung können so sofort dokumentiert werden. Diese Aktualität an freiem topographischen Datenmaterial ist bisher ein Novum. |
||
| + | The image data represents a combination of the spectral channels B8 (NIR), B4 (green) and B3 (blue). |
||
| − | Folgende Produkte werden derzeit vom LVGL bereitgestellt: |
||
| − | |||
| ⚫ | |||
| − | |||
| − | |||
| − | |||
| − | Wie der Name sagt, gibt ein Echtfarbenbild die Originalfarben wieder und entspricht so der Aufnahme eines Fotos. Die Bilddaten setzen sich aus der Kombination der Spektralkanäle B4 (rot), B3 (grün) und B2 (blau) zusammen. |
||
<div><ul> |
<div><ul> |
||
| − | <li style="display: inline-block;">[[Datei:Sentinel- |
+ | <li style="display: inline-block;">[[Datei:Sentinel-2_Abb4.png|thumb|Figure 4: Sentinel-2 false-colour image taken 02/07/2019, ‘Saar Bow’ detail|link=]]</li> |
| − | <li style="display: inline-block;">[[Datei:Sentinel- |
+ | <li style="display: inline-block;">[[Datei:Sentinel-2_Abb5.png|thumb|Figure 5: Sentinel-2 false-colour image taken 04/12/2019, ‘Saar Bow’ detail|link=]]</li> |
</ul></div> |
</ul></div> |
||
| + | ==== Normalised difference vegetation index (NDVI) ==== |
||
| + | The NDVI is utilised as a metric for vegetation cover on a specific area and therefore visualises vegetation health. The typical reflection gradient for a healthy plant reduces reflectance in the visible red spectrum while boosting reflectance in the near-infrared spectrum. This level of boosting in the near-infrared spectrum will be stronger for healthier (greener) plants. |
||
| ⚫ | |||
| − | |||
| − | |||
| − | |||
| − | Ein CIR-Falschfarbenbild (Colored InfraRed) gibt Aufschluss über die Vitalität von Biomasse, z.B. Gras, Blätter von Büschen, etc. Der dazu verwendete Kanal ist das sogenannte Nahe Infrarot (NIR). Grüne (vitale) Vegetation besitzt einen speziellen spektralen Fingerabdruck. Enthaltenen Farbpigmente wie z.B. das Chlorophyll werden im grünen sichtbaren Bereich durch das eintreffendes Licht reflektiert, welches sich im Infrarotbereich sogar nochmals verstärkt. Aufgrund der hohen Reflexionswerte im infraroten Bereich heben sich somit gesunde Pflanzen in Infrarot-Kanal besonders gut ab. |
||
| − | |||
| − | Dadurch können diese Daten zur Interpretation von verschiedenen Vegetationserscheinungen verwendet werden, wie z.B. bei der Waldschadenskartierung oder bei der Biotoptypenkartierung. |
||
| − | |||
| − | Die Bilddaten setzen sich aus der Kombination der Spektralkanäle B8 (rot), B4 (grün) und B3 (blau) zusammen. |
||
<div><ul> |
<div><ul> |
||
| − | <li style="display: inline-block;">[[Datei:Sentinel- |
+ | <li style="display: inline-block;">[[Datei:Sentinel-2_Formel1.PNG|frameless|link=]] </li> |
| ⚫ | |||
</ul></div> |
</ul></div> |
||
| + | As a normalised metric, the NDVI only accepts values in the range −1 to +1: this compensates for the influence of terrain inclination and lighting conditions. |
||
| − | ==== Normierter Differenzierter Vegetationsindex (NDVI) ==== |
||
| + | The dataset is colour-coded, with colours ranging from brown (no vegetation) to yellow and dark green (healthy vegetation). Negative values indicate surface water. A value between 0 and 0.2 indicates areas virtually free of vegetation, whereas a value close to 1 indicates an area possessing significant green plant coverage. |
||
| − | Der NDVI wird als Maß für die Vegetationsbedeckung einer Fläche verwendet. Er zeigt die Vitalität der Vegetation. Der typische Reflexionsverlauf einer gesunden Pflanze führt auf eine geringe Reflexion im sichtbaren roten Bereich und eine starke Reflexion im nahen infraroten Bereich zurück. Je grüner/gesünder die Pflanze ist, desto stärker ist der Anstieg der Reflexionskurve im nahen infraroten Bereich. |
||
| − | |||
| − | [[Special:MyLanguage/Datei:Sentinel-2_Formel1.PNG|frameless|center|link=]] |
||
| − | |||
| − | Aufgrund der Normierung nimmt der NDVI nur Werte zwischen -1 und +1 an. Es werden dadurch Einflüsse der Geländeneigung und Beleuchtungsverhältnisse kompensiert. |
||
| − | |||
| − | Der Datensatz ist farbcodiert, wobei die Farbskala von braun (keine Vegetation) über gelb bis dunkelgrün (gesunde Vegetation) reicht. Negative Werte bezeichnen Wasserflächen. Ein Wert zwischen 0 und 0.2 entspricht nahezu vegetationsfreien Flächen, während ein Wert nahe 1 auf eine hohe Vegetationsbedeckung mit grünen Pflanzen schließen lässt. |
||
<div><ul> |
<div><ul> |
||
| − | <li style="display: inline-block;">[[Datei:Sentinel-2_Abb6.png|thumb| |
+ | <li style="display: inline-block;">[[Datei:Sentinel-2_Abb6.png|thumb|Figure 6: NDVI calculated from Sentinel-2 data on 02/07/2019, ‘Saar Bow’ detail|link=]]</li> |
| − | <li style="display: inline-block;">[[Datei:Sentinel-2_Abb7.png|thumb| |
+ | <li style="display: inline-block;">[[Datei:Sentinel-2_Abb7.png|thumb|Figure 7: NDVI calculated from Sentinel-2 data on 04/12/2019, ‘Saar Bow’ detail|link=]]</li> |
</ul></div> |
</ul></div> |
||
| + | == Instructions == |
||
| + | |||
| + | <ul class="box" style="margin-top: 0px;"> |
||
| + | <li class="download">[//{{SERVERNAME}}/mediawiki/images/a/af/Anleitung_Sentinel2.pdf Instructions for using the portal application]</li> |
||
| + | </ul> |
||
| − | == |
+ | == Contacts == |
| − | ''' |
+ | '''State Office for Surveying, Geoinformation and Land Development'''<br /> |
| + | Section 2.3 |
||
| − | Sachgebiet 2.3 - Sat-Fernerkundung, InVeKoS, Zora, IT-Sicherheit<br /> |
||
| + | Satellite-Based Remote Sensing, InVeKoS, ZORA, IT Security<br /> |
||
Thomas Engel<br /> |
Thomas Engel<br /> |
||
| − | [mailto:T.Engel@lvgl.saarland.de |
+ | [mailto:T.Engel@lvgl.saarland.de Email]<br /> |
| − | + | Phone: +49 681 9712-223 |
|
Aktuelle Version vom 22. November 2022, 13:58 Uhr
Sentinel-2 Saarland
Viewer
Go to map collection for Sentinel-2 data
Description
Copernicus satellite data
Copernicus is a European Earth observation programme that is organised and conducted by the European Union (EU) in collaboration with the European Space Agency (ESA), the European Organisation for Meteorological Satellites (EUMETSAT) and the EU member states. Copernicus consists of various systems for data collection and combines remote sensing with local measurements (in-situ component). The observational data is used to derive information of relevance for the environment and security for five core services. These services primarily address the environment, climate, sustainable development, humanitarian aid and public security.
The Copernicus programme also maintains its own fleet of satellites: these Sentinel satellites are used for the global observation of the atmosphere, oceans and land surfaces. Sentinel data and the Copernicus services are available free of charge and in full for anyone to use – from public-sector personnel to researchers, commercial companies as well as charitable organisations and private citizens.
Multispectral image data (Sentinel-2)
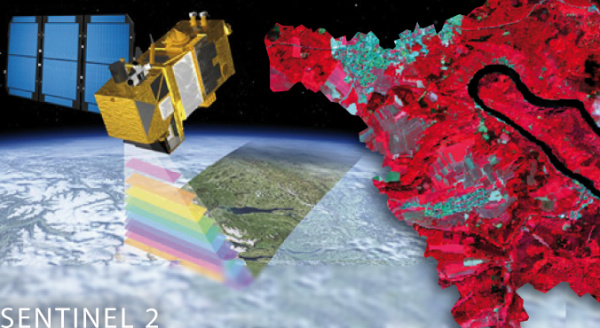
Saarland’s State Office for Surveying, Geoinformation and Land Development (LVGL) provides continuously updated data from Sentinel-2 satellites free of charge. The Sentinel-2 Mission consists of a pair of structurally identical satellites, which circle the Earth at 180° to one another on the same orbit and at a height of approximately 786 km. This arrangement ensures that Saarland is overflown roughly once every five days. Sentinel-2 is equipped with a multispectral instrument (MSI) featuring a total of 13 spectral channels (figure 1).
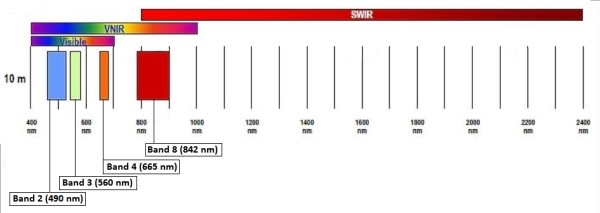 Figure 1: Sentinel-2 spectral channels with 10 m spatial resolution: B2 (blue: 490 nm), B3 (green: 560 nm), B4 (red: 665 nm) and B8 (NIR: 842 nm) [©ESA2020 Sentinel Online User Guides ]
Cloud cover means that a clear view of the Earth’s surface is often unavailable. Accordingly, the State Office views the current data and provides images of Saarland that are clear of clouds.
The image data provided features a spatial resolution of 10 m x 10 m and is post-processed to the ‘Level-2A’ data standard, i.e. georeferenced, radiometrically optimised and atmosphere-corrected. We recommend viewing the data at a 1:50,000 or smaller scale. Data can be provided via GeoPortal Saarland as well as the ZORA cartographic information system. Data can also be obtained using a web map service (WMS).
The image data is particularly suited to use in large-scale topography applications, where changes in topography, vegetation or land use can be visualised immediately. This availability of up-to-date topographic datasets is a novel development.
The following products are currently offered by the LVGL:
True-colour images (TrueColorImage, TCI)
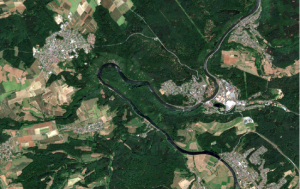
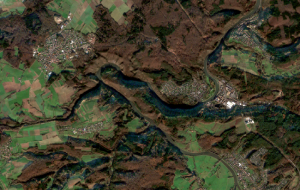
As the name suggests, a true-colour image faithfully represents the original colours and is therefore equivalent to a photograph. The image data represents a combination of the spectral channels B4 (red), B3 (green) and B2 (blue).
False-colour images (Colored InfraRed, CIR)
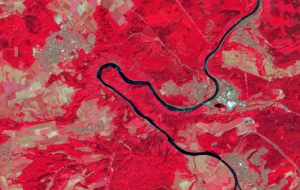
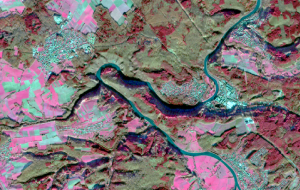
A CIR false-colour image (Colored InfraRed) can be used to visualise the health of biomass, such as grasses, leaves on bushes, etc. The channel used for these images is the near-infrared (NIR) channel. Green (healthy) vegetation has a particular ‘spectral fingerprint’: the pigments in this vegetation, such as chlorophyll, are reflected in the green visible spectrum by incident light and this effect is further reinforced in the infrared spectrum. As a result of the high reflectance in the infrared spectrum, healthy plants are therefore especially prominent in infrared.
Accordingly, this data can be used to interpret a range of potential manifestations of vegetation, such as mapping forest damage or surveying different types of biotopes.
The image data represents a combination of the spectral channels B8 (NIR), B4 (green) and B3 (blue).
Normalised difference vegetation index (NDVI)
The NDVI is utilised as a metric for vegetation cover on a specific area and therefore visualises vegetation health. The typical reflection gradient for a healthy plant reduces reflectance in the visible red spectrum while boosting reflectance in the near-infrared spectrum. This level of boosting in the near-infrared spectrum will be stronger for healthier (greener) plants.
As a normalised metric, the NDVI only accepts values in the range −1 to +1: this compensates for the influence of terrain inclination and lighting conditions.
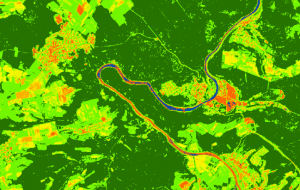
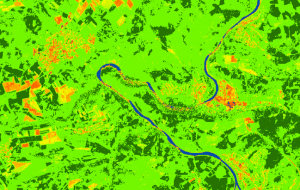
The dataset is colour-coded, with colours ranging from brown (no vegetation) to yellow and dark green (healthy vegetation). Negative values indicate surface water. A value between 0 and 0.2 indicates areas virtually free of vegetation, whereas a value close to 1 indicates an area possessing significant green plant coverage.
Instructions
Contacts
State Office for Surveying, Geoinformation and Land Development
Section 2.3
Satellite-Based Remote Sensing, InVeKoS, ZORA, IT Security
Thomas Engel
Email
Phone: +49 681 9712-223
