Wasser/en
Flood hazard and flood risk maps in Saarland
Viewer
Go to application: ‘Flood protection’
Description
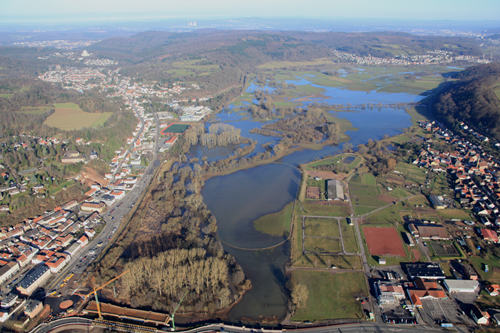
As part of the natural water cycle, flooding is a naturally occurring event. Whether or not this then becomes a disaster depends solely on the use of the affected areas by human society. The information presented here is intended to help those affected to recognise the risks and initiate appropriate countermeasures when necessary. The most important tools for these activities are flood hazard maps and flood risk maps.
Flood hazard maps are used to show the flooded areas and the depth of water in these areas for a specific event. In contrast, flood risk maps show the primary usage types for areas at risk of flooding, and also supply additional information such as the number of inhabitants affected or the location of protected areas and relevant industrial estates. Both types of map are based on hydraulic calculations of flood drainage into surface waters and their catchment areas. Depending on the complexity of flow relationships, both one- and two-dimensional models are available for calculating the water level. Accordingly, accuracy is limited by the available datasets as well as the modelling technology.
Available maps in Saarland
A number of different scenarios are represented by these maps: a hundred-year flood is an event that occurs once every 100 years on average. Equally, however, the flood could occur next week and then again next year. An extreme flood is an even more severe event, with flooding several centimetres higher, possibly accompanied by even heavier rain, damage to bridges and pipework, as well as the failure of flood protection systems.
Since considerable effort goes into the preparation of these maps, maps will not be available for all flood risk areas until the end of 2013.
Hazard maps
On hazard maps, the water depth is represented at five separate levels, using different shades of blue. The same levels in shades of yellow are used to indicate regions behind floodwater protection systems, such as the Ziegelhütte in Ottweiler, which lies behind an embankment. This yellow shading is intended to indicate the residual risks present behind embankments and dikes, since these areas will be flooded if the protection system fails. Alongside additional cartographic information, floodwater protection systems and bridges are also shown. In the title block, the water level at the corresponding measuring station is also specified at which flooding at the extent shown is to be expected. Accordingly, those affected can use the forecasts from the flood monitoring centre to prepare in good time for any impending threat.
Risk maps
Flooding risk maps do not show the water depth itself but instead indicate the type of land use for flooded areas. Areas affected by flooding are colour-coded according to their usage type (such as agriculture, settlements, green spaces, etc.). Areas protected by dikes are shown with cross-hatching. Risk maps also show protected areas and industrial estates where flooding could also involve a potential environmental disaster (known as IPPC facilities). Depending on the area of the settlement subject to flooding, the number of inhabitants potentially affected is estimated for each district, and shown on the maps as a symbol and number. Once again, for example, we see that the Ziegelhütte in Ottweiler is protected by an embankment. In an extreme flooding event, this would also be breached and areas of the town would be under water.
Downloads
- Instructions for using the portal application
- Video: ‘Portal application information and instructions’
- Download geo specialist data
Further reading
- Ministry for the Environment and Consumer Protection
- Federal/State Working Group on Water (LAWA, 2010)
- State Office for the Environment and Occupational Safety
Contacts
Ministry for the Environment and Consumer Protection
Dept. E2 Flood Protection
Dr. Manuela Gretzschel
Email
Phone: +49 681 501-4773
