Sentinel-2/en
Sentinel-2 Saarland
Viewer
Go to map collection for Sentinel-2 data
Description
Copernicus satellite data
Copernicus is a European Earth observation programme that is organised and conducted by the European Union (EU) in collaboration with the European Space Agency (ESA), the European Organisation for Meteorological Satellites (EUMETSAT) and the EU member states. Copernicus consists of various systems for data collection and combines remote sensing with local measurements (in-situ component). The observational data is used to derive information of relevance for the environment and security for five core services. These services primarily address the environment, climate, sustainable development, humanitarian aid and public security.
The Copernicus programme also maintains its own fleet of satellites: these Sentinel satellites are used for the global observation of the atmosphere, oceans and land surfaces. Sentinel data and the Copernicus services are available free of charge and in full for anyone to use – from public-sector personnel to researchers, commercial companies as well as charitable organisations and private citizens.
Multispectral image data (Sentinel-2)
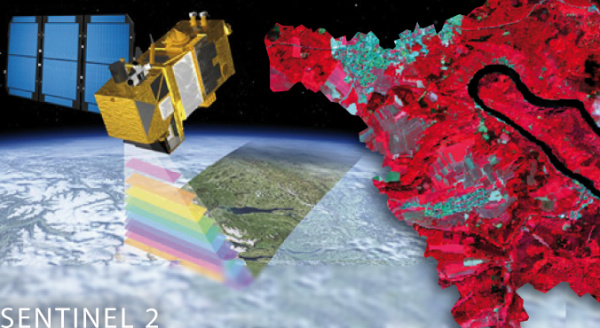
Saarland’s State Office for Surveying, Geoinformation and Land Development (LVGL) provides continuously updated data from Sentinel-2 satellites free of charge. The Sentinel-2 Mission consists of a pair of structurally identical satellites, which circle the Earth at 180° to one another on the same orbit and at a height of approximately 786 km. This arrangement ensures that Saarland is overflown roughly once every five days. Sentinel-2 is equipped with a multispectral instrument (MSI) featuring a total of 13 spectral channels (figure 1).
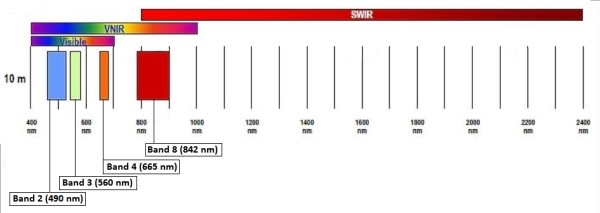 Figure 1: Sentinel-2 spectral channels with 10 m spatial resolution: B2 (blue: 490 nm), B3 (green: 560 nm), B4 (red: 665 nm) and B8 (NIR: 842 nm) [©ESA2020 Sentinel Online User Guides ]
Cloud cover means that a clear view of the Earth’s surface is often unavailable. Accordingly, the State Office views the current data and provides images of Saarland that are clear of clouds.
The image data provided features a spatial resolution of 10 m x 10 m and is post-processed to the ‘Level-2A’ data standard, i.e. georeferenced, radiometrically optimised and atmosphere-corrected. We recommend viewing the data at a 1:50,000 or smaller scale. Data can be provided via GeoPortal Saarland as well as the ZORA cartographic information system. Data can also be obtained using a web map service (WMS).
The image data is particularly suited to use in large-scale topography applications, where changes in topography, vegetation or land use can be visualised immediately. This availability of up-to-date topographic datasets is a novel development.
The following products are currently offered by the LVGL:
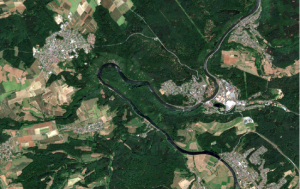
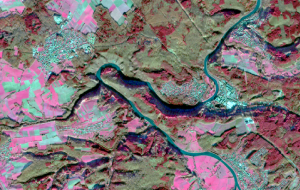
True-colour images (TrueColorImage, TCI)
As the name suggests, a true-colour image faithfully represents the original colours and is therefore equivalent to a photograph. The image data represents a combination of the spectral channels B4 (red), B3 (green) and B2 (blue).
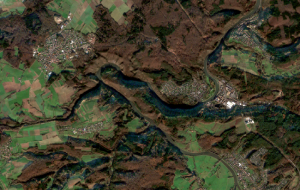
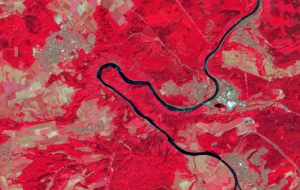
False-colour images (Colored InfraRed, CIR)
A CIR false-colour image (Colored InfraRed) can be used to visualise the health of biomass, such as grasses, leaves on bushes, etc. The channel used for these images is the near-infrared (NIR) channel. Green (healthy) vegetation has a particular ‘spectral fingerprint’: the pigments in this vegetation, such as chlorophyll, are reflected in the green visible spectrum by incident light and this effect is further reinforced in the infrared spectrum. As a result of the high reflectance in the infrared spectrum, healthy plants are therefore especially prominent in infrared.
Accordingly, this data can be used to interpret a range of potential manifestations of vegetation, such as mapping forest damage or surveying different types of biotopes.
The image data represents a combination of the spectral channels B8 (NIR), B4 (green) and B3 (blue).
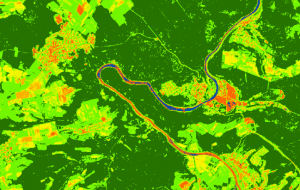
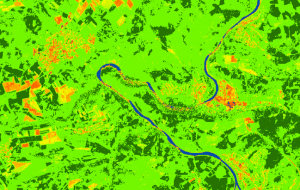
Normalised difference vegetation index (NDVI)
The NDVI is utilised as a metric for vegetation cover on a specific area and therefore visualises vegetation health. The typical reflection gradient for a healthy plant reduces reflectance in the visible red spectrum while boosting reflectance in the near-infrared spectrum. This level of boosting in the near-infrared spectrum will be stronger for healthier (greener) plants.
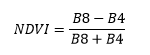
As a normalised metric, the NDVI only accepts values in the range −1 to +1: this compensates for the influence of terrain inclination and lighting conditions.
The dataset is colour-coded, with colours ranging from brown (no vegetation) to yellow and dark green (healthy vegetation). Negative values indicate surface water. A value between 0 and 0.2 indicates areas virtually free of vegetation, whereas a value close to 1 indicates an area possessing significant green plant coverage.
Instructions
Contacts
State Office for Surveying, Geoinformation and Land Development
Section 2.3
Satellite-Based Remote Sensing, InVeKoS, ZORA, IT Security
Thomas Engel
Email
Phone: +49 681 9712-223